
6.1 Basics
6.1.1 Building a plot using ggplot2
6.1.1.1 Packages and Sample Data
# Packages
library(haven)
library(ggplot2)

# Data
adam_path <- "https://github.com/phuse-org/TestDataFactory/raw/main/Updated/TDF_ADaM/"
adsl <- as.data.frame(haven::read_xpt(paste0(adam_path, "adsl.xpt")))
Let’s create a basic scatter plot of weight vs height.
# basic scatter plot of weight vs height
my_scatter_plot <- ggplot(adsl, aes(x = HEIGHTBL, y = WEIGHTBL)) +
  geom_point()
my_scatter_plot
## Warning: Removed 1 rows containing missing values (`geom_point()`).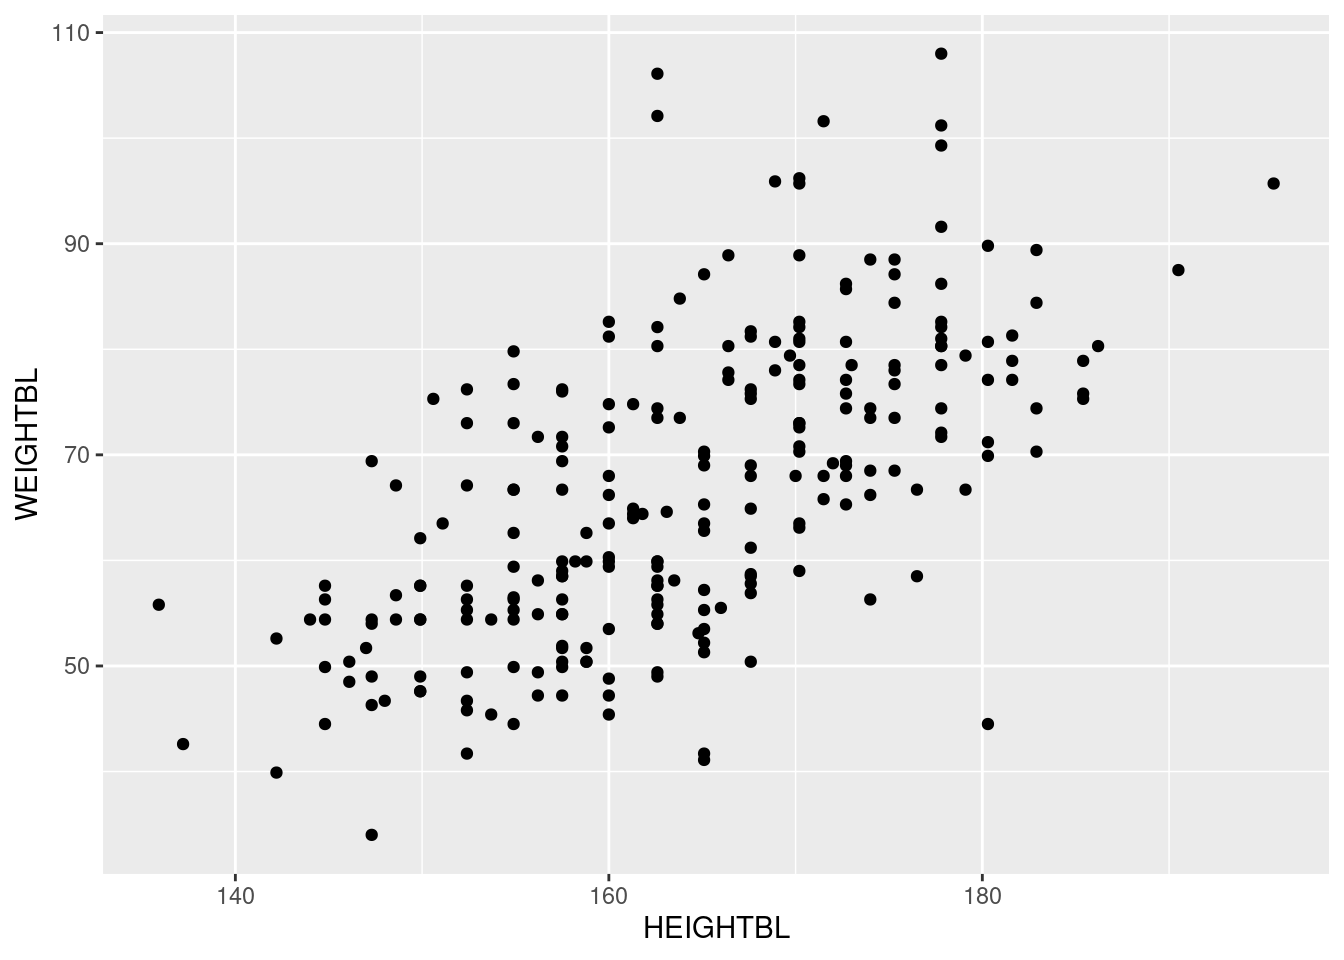
6.1.2 Exporting plots
You may export plots as png files a few ways. If your plot is created in ggplot2, you can use the ggsave() function to export as png:
# save plot as a png file
ggsave(plot = my_scatter_plot,
       filename = "my_plot_output_1.png",
       width = 7,
       height = 5,
       units = "in")
The more general way to save plots as png files is to use the png() function. It can work with ggplot2, but also plots created in base R.
png(filename = "my_plot_output_2.png",
    width = 7,
    height = 5,
    units = "in",
    res = 300)

print(my_scatter_plot)
dev.off()