Perform Step-Down Rao-Scott Adjusted Cochran-Armitage Trend Test Procedure
Source:R/RSCABS_AO.R
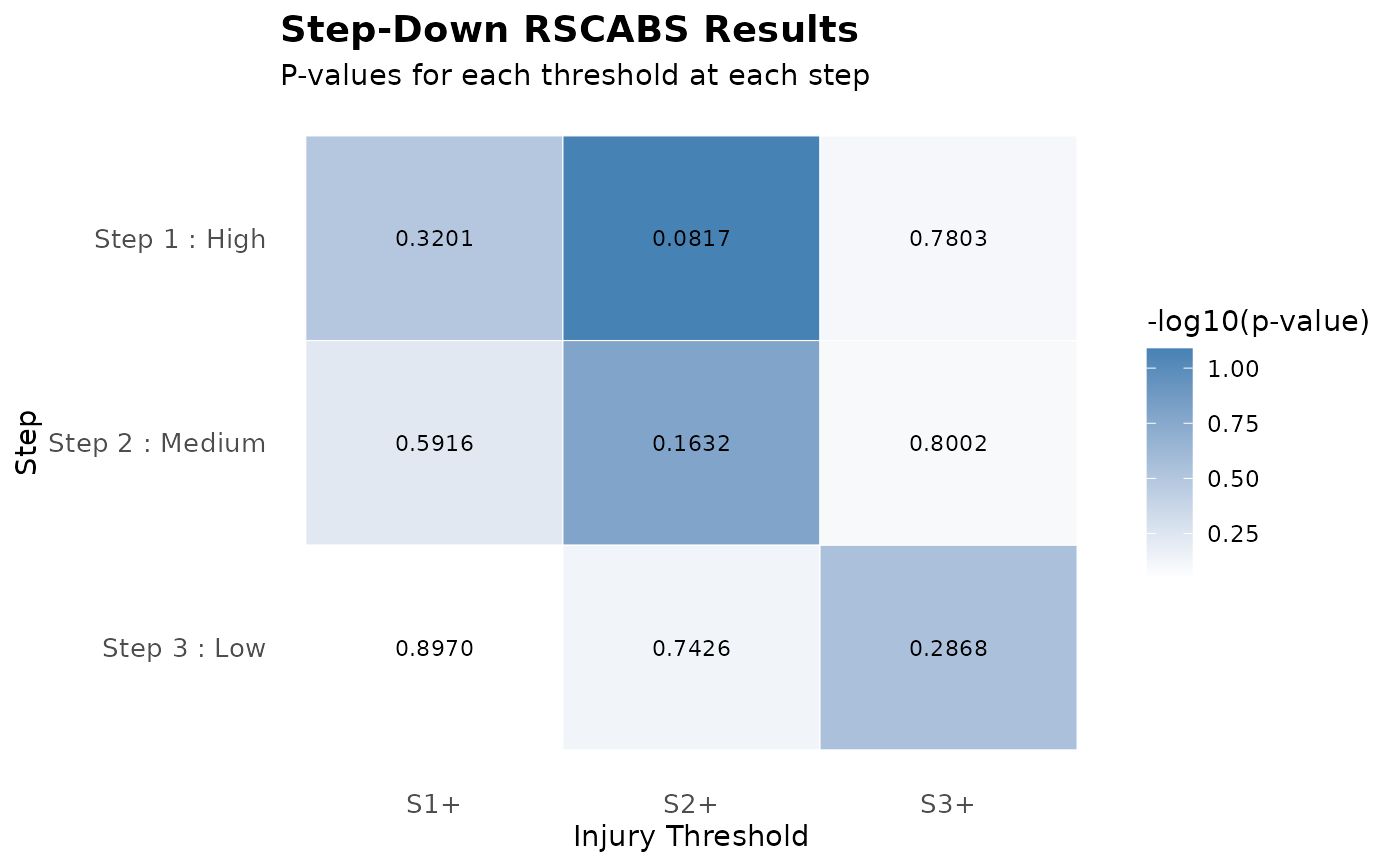
step_down_RSCABS.RdThis function performs a step-down procedure using Rao-Scott adjusted Cochran-Armitage trend tests (RSCABS). The procedure systematically excludes the highest treatment groups to identify at which treatment level the dose-response relationship becomes significant.
Usage
step_down_RSCABS(
  data,
  treatment_col = "tmt",
  treatment_order = NULL,
  max_score = NULL,
  min_score = 1,
  score_cols = NULL,
  replicate_col = "tank",
  total_col = "total",
  direction = "greater",
  alternative = "greater",
  include_fisher = TRUE
)
Arguments
- data
A data frame containing fish injury data
- treatment_col
Name of the column containing treatment groups (default: "tmt")
- treatment_order
Optional vector specifying the order of treatment groups from lowest to highest dose. If NULL, alphabetical order is used (default: NULL)
- max_score
Maximum score value to consider (default: NULL, auto-detected)
- min_score
Minimum score value to consider (default: 1)
- score_cols
Character vector of column names containing injury scores (default: NULL, auto-detected)
- replicate_col
Name of the column containing tank/replicate IDs (default: "tank")
- total_col
Name of the column containing total counts (default: "total")
- direction
Character string indicating threshold direction: "greater" for \ge threshold, "less" for \le threshold (default: "greater")
- alternative
Character string specifying the alternative hypothesis: "two.sided", "greater" (proportion increases with treatment level), or "less" (proportion decreases with treatment level) (default: "greater")
- include_fisher
Logical indicating whether to use Fisher's exact test when RSCA fails (default: TRUE)
Value
A list of class "StepDownRSCABS" containing:
- combined_results
Data frame with test results for all steps and thresholds
- step_results
List of RSCABS objects for each step
- summary
Summary of significant findings by step
- lowest_significant
Information about the lowest significant treatment level
- parameters
List of parameters used for the analysis
Examples
# Example data
fish_data <- data.frame(
  tmt = c(rep("Control", 8), rep("Low", 4), rep("Medium", 4), rep("High", 4)),
  tank = c(paste0("C", 1:8), paste0("L", 1:4), paste0("M", 1:4), paste0("H", 1:4)),
  S0 = c(3, 2, 3, 2, 2, 1, 2, 3, 3, 3, 4, 2, 2, 3, 2, 2, 2, 3, 1, 2),
  S1 = c(1, 2, 0, 1, 2, 2, 1, 1, 1, 1, 0, 1, 1, 0, 1, 1, 1, 1, 2, 0),
  S2 = c(0, 0, 0, 0, 0, 1, 0, 0, 0, 0, 0, 1, 1, 1, 0, 1, 0, 0, 1, 1),
  S3 = c(0, 0, 1, 1, 0, 0, 1, 0, 0, 0, 0, 0, 0, 0, 1, 0, 1, 0, 0, 1),
  total = c(4, 4, 4, 4, 4, 4, 4, 4, 4, 4, 4, 4, 4, 4, 4, 4, 4, 4, 4, 4)
)

# Run step-down procedure with default parameters
result <- step_down_RSCABS(fish_data, treatment_col = "tmt",
                          treatment_order = c("Control", "Low", "Medium", "High"))
#> Warning: Some treatment groups have zero affected individuals at threshold S3+. RSCA test may not be valid.
#> Warning: Some treatment groups have zero affected individuals at threshold S3+. RSCA test may not be valid.
#> Warning: Some treatment groups have zero affected individuals at threshold S3+. RSCA test may not be valid.

# Print results
print(result)
#> Step-Down RSCABS Analysis
#> ========================
#>
#> Parameters:
#>   Direction: greater
#>   Alternative hypothesis: greater
#>   Treatment levels: Control, Low, Medium, High
#>
#> Summary of findings:
#> Step 1 : Included treatments: Control, Low, Medium, High
#>   No significant findings
#> Step 2 : Included treatments: Control, Low, Medium
#>   No significant findings
#> Step 3 : Included treatments: Control, Low
#>   No significant findings

# Plot results
plot(result)