library(drcHelper)
#> Loading required package: drc
#> Loading required package: MASS
#> Loading required package: drcData
#>
#> 'drc' has been loaded.
#> Please cite R and 'drc' if used for a publication,
#> for references type 'citation()' and 'citation('drc')'.
#>
#> Attaching package: 'drc'
#> The following objects are masked from 'package:stats':
#>
#>     gaussian, getInitial
source("../knitr-setup.R")
Background
What is a trend test
A trend test is used to detect a monotonic trend across ordered groups. It’s particularly useful in dose-response studies to identify whether increasing doses lead to a systematic change in response.
The prerequisite for a trend test is that the relationship is monotonic, either consistently increasing or decreasing. These trend tests are specifically designed to detect trends, making it a bit more powerful than general tests when a trend exists.
The disadvantage is that it does not consider the magnitude of the change across the ordered groups, leading to unexpected identification of significance when there It is also less informative or even give counter-intuitive results if the relationship is not monotonic or if the groups are not naturally ordered.
Some concerns
In lots of the decision flowcharts, step down trend test are performed after a monotonicity test passes, which is logically strange, since monotonicity test itself is also a type of trend test. For example, jonckeehre terpstra test after linear contrast is significant in monotonicity test or quadratic contrast is significant in monotonicity test.
Trend Test by Testing Linear and Quadratic Contrasts
Generate mock data for testing
library(ggplot2)
mock_data <- data.frame(
  treatment_var = factor(rep(c("Control", "Dose1", "Dose2", "Dose3"), each = 10)),
  response_var = c(rnorm(10, mean = 5), rnorm(10, mean = 7), rnorm(10, mean = 8), rnorm(10, mean = 10))
)
ggplot(mock_data,aes(x=treatment_var,y=response_var))+geom_point()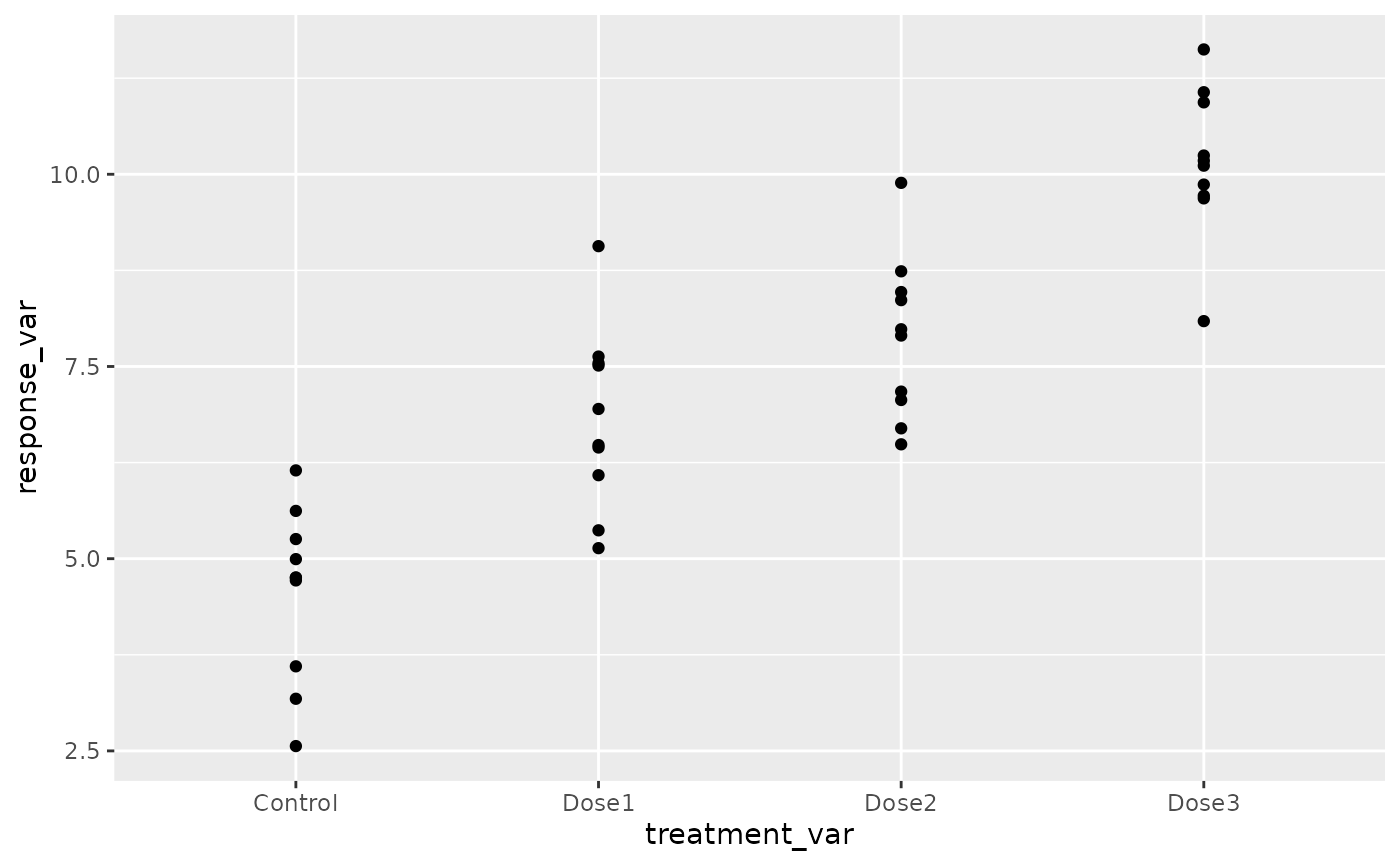
result <- monotonicityTest(mock_data, "treatment_var", "response_var")
result
#>        Test t value Pr(>|t|) Significance
#> 1    Linear   11.16  <0.0001          ***
#> 2 Quadratic   -0.10   0.9196            .
Step-Down Trend Test
A step-down trend test is a sequential testing procedure used to identify the lowest dose level at which a significant trend begins. The process works as follows:
- Start with all dose groups and test for a trend.
- If significant, remove the highest dose group and test again.
- Continue this process until either:
- The test is no longer significant, indicating you’ve found the lowest effective dose
- Only two groups remain (typically control and lowest dose)
This approach helps identify the No Observed Effect Concentration (NOEC) or Lowest Observed Effect Concentration (LOEC) in dose-response studies.
The function PMCMRplus::stepDownTrendTest PMCMRplus
implements this strategy for continuous data using various trend tests.
For binomial survival data, we adapt this approach using the
Cochran-Armitage test, which is specifically designed for binary
outcomes across ordered groups, the function for performing step-down CA
is called drcHelper::stepDownTrendTestBinom. There is also
drcHelper::step_down_RSCABS and
drcHelper::stepDownRSCABS for oridinal data. Please refere
to the relevant data page for usage demo and explanations.